Cameroon’s Presidential Election: Playing with Numbers Is a Dangerous Game
This article presents a personal view and analysis of data from Cameroon’s presidential election by Guillaume Tanga, a data and finance professional from Cameroon.
As countries debate machine learning, politicians in my home country Cameroon still gamble with simple arithmetic. On 27 October 2025, the Constitutional Council published the official results of the presidential election held two weeks earlier. The pattern is familiar: late communication, limited transparency, and a result that raises more questions than it answers.
The Council’s tally declares Paul Biya the winner and credits Issa Tchiroma Bakary (ITB) with roughly 35%. ITB says he won. Rather than trade claims, I went to the tables, the division-by-division (department) figures in the Council’s own documents and asked a simple question: do these numbers hang together?
Two Countries on One Ballot
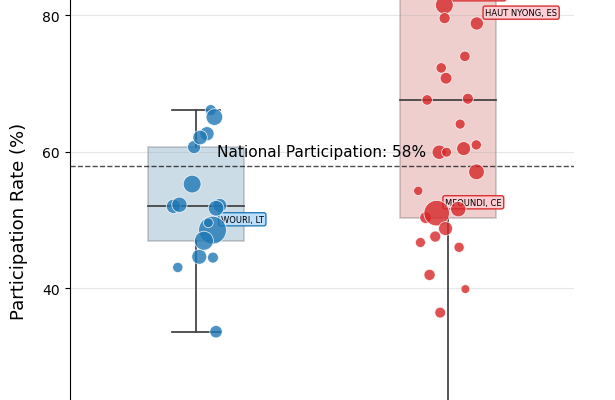
Plot the participation rate by division and two realities appear:
- In one Cameroon, turnout sits around 50 to 60 percent. This looks like normal electoral behaviour.
- In the other, turnout rockets to 80, 90, sometimes 97 percent. It is as if nobody moved, nobody travelled, nobody abstained, and mortality took a holiday.
The participation rate is taken directly from the Constitutional Council’s official division-level results (27 October 2025). Each dot represents one division, and dot size reflects the number of voters in that division.
Divisions are grouped by which candidate ranked higher between Paul Biya and Issa Tchiroma Bakary (ITB): “Biya ahead” means Biya received more votes than ITB; “Tchiroma ahead” means ITB received more votes than Biya. The dashed line marks the national participation rate (58%), as reported. Other candidates also received votes; this visualization isolates the relative Biya-vs-ITB pattern, not the full candidate field.
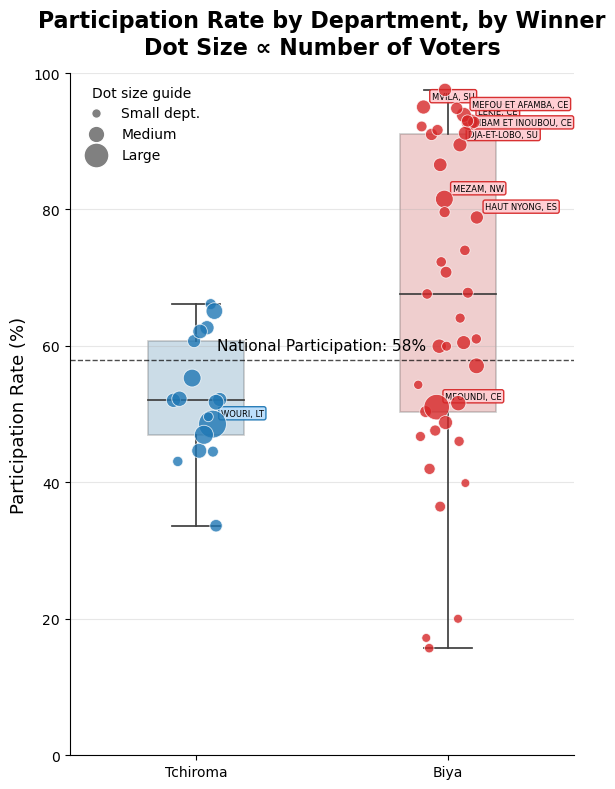
As participation rises, Paul Biya’s margins rise with it. Where turnout is ordinary, ITB is competitive or ahead.
Where turnout is extraordinary, Biya wipes out those gains. Correlation is not proof, but patterns like this demand scrutiny.
Where Does the National Lead Come from?
The official margin credits Biya with a lead close to 800,000 votes. In the data, roughly 700,000 of that advantage sits in a small cluster of divisions with average participation near 89 percent. The eyebrow-raising case is Mezam in the North West, despite being a conflict zone with a long record of hostility to Biya, reported exceptional participation and a decisive margin for him.
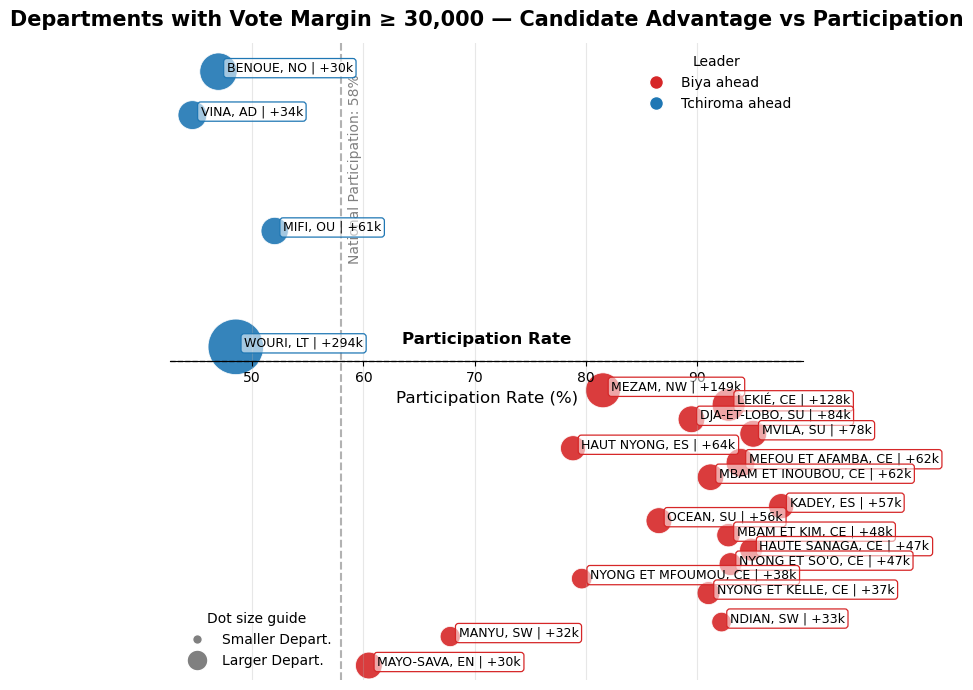
This figure includes only divisions where the vote margin between Paul Biya and Issa Tchiroma Bakary (ITB) exceeded 30,000 votes (total 21). The vote margin is calculated as the difference in the number of votes reported for the two candidates in each division (Biya – ITB). The vertical axis ranks these divisions by the absolute size of this vote margin. The rank is displayed with a sign: divisions where Biya leads are shown below the horizontal line, while those where ITB leads are shown above it. The horizontal axis shows the participation rate as reported directly by the Constitutional Council (27 October 2025). Dot size is proportional to the total number of voters in each division. The dashed vertical line indicates the national participation rate (58%). Division names are annotated with region initials and the rounded vote margin.
A Stress Test of the Numbers
To test how dependent the national picture is on ultra-high turnout pockets, I recomputed the scoreboard after excluding divisions above different participation thresholds. This is a sensitivity check.
In plain language, this shows what the result would be if only votes below this threshold for turnout are included.
|
Participation Rate Acceptance Threshold |
Biya % |
Tchiroma % | Difference |
Divisions kept |
| 90% | 47.0 | 40.8 | 6.3 | 47 |
| 80% | 42.7 | 44.2 | -1.5 | 44 |
| 70% | 39.9 | 46.4 | -6.5 | 39 |
| 60% | 37.4 | 47.8 | -10.4 | 29 |
This analysis examines how the national result changes when divisions with exceptionally high participation rates are excluded. For context, the file of official totals reads: Biya 53.7 percent, ITB 35.2 percent, difference 18.65 points. Participation rates are taken directly from the Constitutional Council’s official publication (27 October 2025). For each threshold (90%, 80%, 70%, 60%), divisions reporting participation above that level were removed, and the vote totals for Paul Biya and Issa Tchiroma Bakary were recalculated only across the remaining divisions. No external data, assumptions, or projections were introduced — only the removal of divisions with extreme turnout.
The divisions excluded at the highest thresholds are statistical outliers: they report levels of voter turnout (sometimes above 90%) that do not match the national distribution, nor typical patterns in electoral democracies, nor the known conditions on the ground (conflict zones, displacement, civil unrest, and documented barriers to voting). Such extreme participation rates are widely recognized in election monitoring literature as high-risk indicators for result fabrication or ballot manipulation.
Therefore, this sensitivity test does not assert fraud; it shows that the official national margin depends disproportionately on a small cluster of divisions with turnout levels that are demographically and logistically improbable. When these outlier divisions are removed, the reported winner changes.
When you drop the ultra-turnout divisions above 90 percent of participation, only 7 points separate both candidates. Below 80 percent, Biya no longer has a majority and ITB leads. By 70 percent, ITB win absolute majority.
According to this analysis, Biya couldn’t have won this election, and yet he might rule over his people for another 7 years destroying the country’s future while the world is just watching.